Different techniques to identify blocking in SQL Server
Problem
SQL Server is able to service requests from a large number of concurrent users. When SQL Server is servicing requests from many clients, there is a strong possibility that conflicts will occur because different processes request access to the same resources at the same time. A conflict in which one process is waiting for another to release a resource is called a block. Although in SQL Server a blocked process usually resolves itself when the first process releases the resource but there are times when a process holds a transaction lock and doesn’t release it. In this tip, we will learn different techniques to troubleshoot and resolve blocks in SQL Server.
Solution
In order to resolve a blocked process, we first need to determine which process is the blocking process and then if possible kill the blocking process. There are many different ways in SQL Server to identify a blocks and blocking process that are listed as follow:
- Activity Monitor
- SQLServer:Locks Performance Object
- DMVs
- sys.dm_exec_requests
- sys.dm_tran_locks
- sys.dm_os_waiting_tasks
- SQL Server Profiler Locks Event Category
Each of these tools reports different information which is helpful in resolving blocks quickly. Let’s have a look at these tools in details:
- sys.dm_exec_requests
- sys.dm_tran_locks
- sys.dm_os_waiting_tasks
1) Using SQL Script
Method 1:
Get List of Blocked SID from the SP:
1.SP_who2 Active
1.SP_who2 Active
or
2.SELECT spid FROM master..SYSPROCESSES WHERE blocked0
2.SELECT spid FROM master..SYSPROCESSES WHERE blocked0
Let’s say 56 is the spid blocking
Details about Blocked SID:
DBCC INPUTBUFFER(56) — Will give you the Event Info
KILL 56
DBCC INPUTBUFFER(56) — Will give you the Event Info
KILL 56
Method 2:
The following is the query, which I have written using these dynamic management views (DMVs) that will help you to quickly identify the SPIDs and other information about the processes that are causing the blocking on SQL Server instance. This query returns the comprehensive information about the blocking and waiting processes, which is useful for troubleshooting SQL Server locking and blocking issues. This query is also a good way to analyze detailed information about locks, and help you to identify the cause of a large number of blocks.
Sample Output
To examine the results of this query, run it on SQL Server where you are experiencing blocks. For example, when I executed this query on my test SQL Server where I'm deliberately running some code to cause blocking, it brings the following results (Note: To fit the resultset, I've split the resultset into seven images):
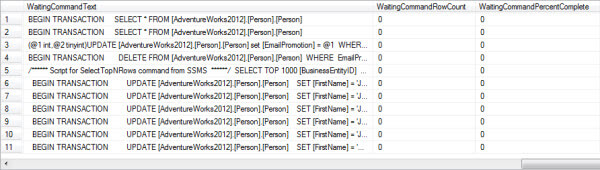
The following are the columns returned by this query:
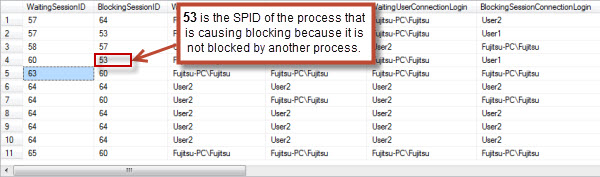
- WaitingSessionID – The SPID of the waiting session.
- BlockingSessionID – The SPID of the blocking session.
- WaitingSessionUserLogin – The user session login name under which waiting session is currently executing.
- BlockingSessionUserLogin – The user session login name under which blocking session is currently executing.
- WaitingUserConnectionLogin – The login name that the user used to create waiting session.
- BlockingSessionConnectionLogin – The login name that the user used to create waiting session.
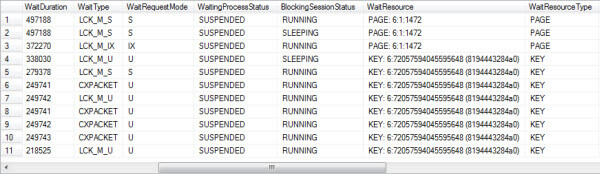
- WaitDuration – Waiting process wait time in milliseconds.
- WaitType – Type of wait.
- WaitRequestMode – Mode of the wait request.
- WaitingProcessStatus – The status of waiting process.
- BlockingSessionStatus – The status of blocking process.
- WaitResource – The name of the resource request is waiting for.
- WaitResourceType – The type of the resource request is waiting for.
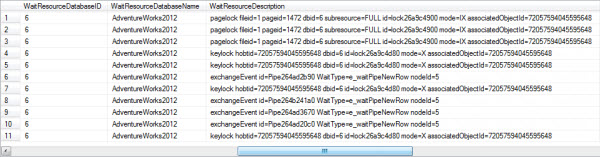
- WaitResourceDatabaseID – The database id of the database in which the requested resource exists.
- WaitResourceDatabaseName – The name of the database in which the requested resource exists.
- WaitResourceDescription – The detailed description of the waiting resource.
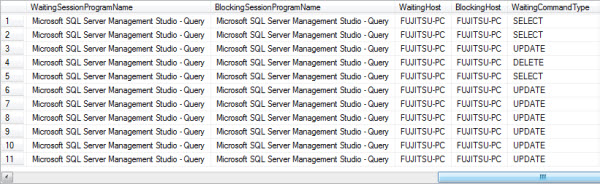
- WaitingSessionProgramName – The name of the program that initiated the waiting session.
- BlockingSessionProgramName – The name of the program that initiated the blocking session.
- WaitingHost – The name of the workstation that is specific to waiting session.
- BlockingHost – The name of the workstation that is specific to blocking session.
- WaitingCommandType – The type of waiting session command.
- WaitingCommandText – The text of waiting session command.
- WaitingCommandRowCount – Expected number of rows return by the waiting session.
- WaitingCommandPercentComplete – Percentage of the waiting request client.
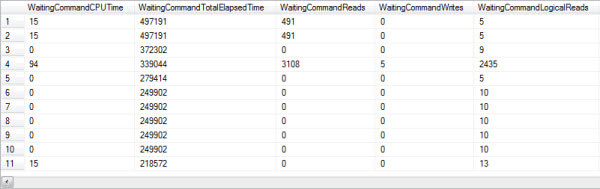
- WaitingCommandCPUTime – CPU time used by waiting session.
- WaitingCommandTotalElapsedTime – The total time elapsed in milliseconds since the waiting request arrived.
- WaitingCommandReads – The number of reads performed by the waiting session request.
- WaitingCommandWrites – The number of writes performed by the waiting session request.
- WaitingCommandLogicalReads – The number of logical reads performed by the waiting session request.
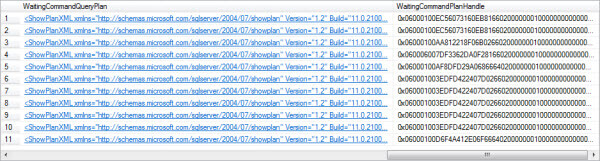
- WaitingCommandQueryPlan – Waiting command execution plan.
- WaitingCommandPlanHandle – Plan handle of the waiting session command.
As you can see from above resultset, that process 53 listed BlockingSessionID column of row 4 is not blocked by another process, hence identified as the SPID that is the cause of the blocking on my test SQL Server instance.
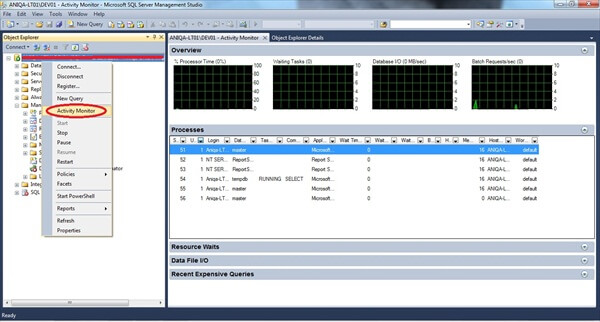
1) Activity Monitor
Activity Monitor is a tool in SQL Server Management Studio that gives you a view of current connections on SQL Server. You can use Activity Monitor to view information about the current processes and locks held on SQL Server resources. To open Activity Monitor in SQL Server Management Studio, right-click the SQL Server instance name in Object Explorer and then select Activity Monitor:
Launch Activity Monitor
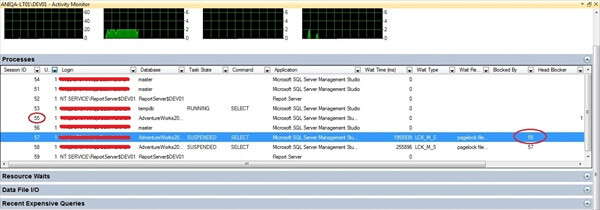
To find blocked process with Activity Monitor, first click on Processes in Activity Monitor to open the Process Info page:
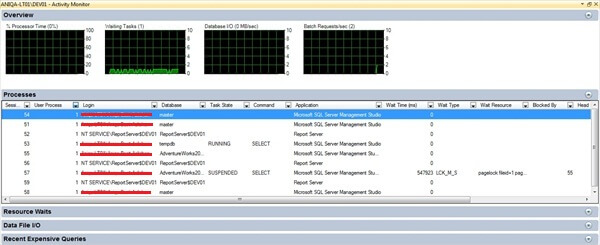
Process Info Page and Locating Blocking Process
Then locate the process that is waiting, and then scroll over to the Blocked By column and note the Process ID in that column. Find that Process ID in Process Info page. and
If you want to terminate the blocking process, right-click it and choose Kill Process:
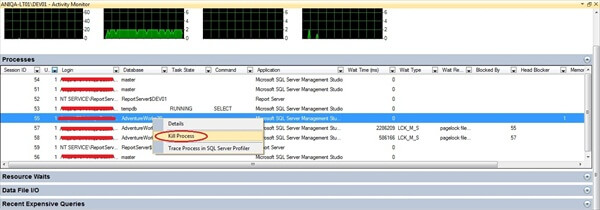
If you want to terminate the blocking process, right-click it and choose Kill Process:
2) The SQLServer:Locks performance object
You use SQLServer:Locks object counter in Performance Monitor to view current statistics or create a log or alert to monitor locks. For example, you can monitor Average Wait Time, Number of deadlocks/sec and Lock Timeouts/secstatistics to determine whether there is a problem with resource contention on SQL Server. However, you will need additional information to determine the exact cause of the problem. Follow the steps below to monitor the SQLServer: Locks performance counter:
On the Start menu, point to Run, type perfmon in the Run dialog box, and then click OK to launch Performance Monitor.
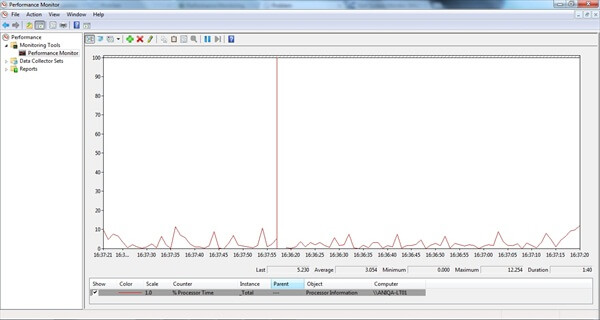
Launching Performance Monitor
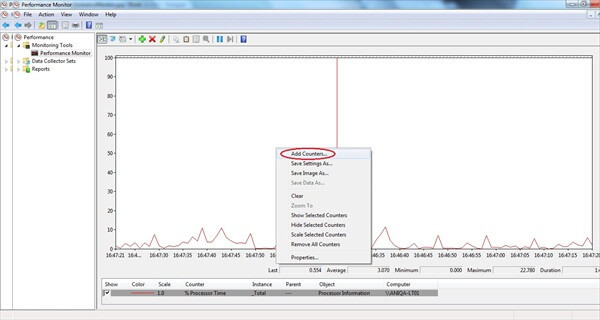
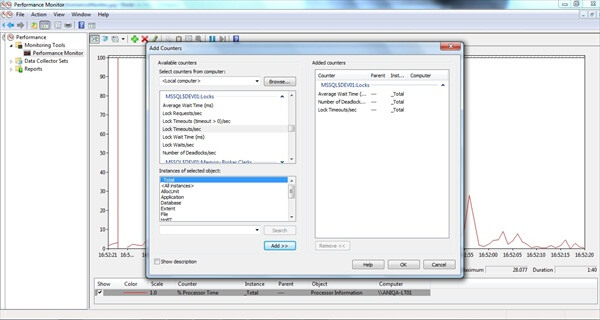
Add counters
- Average Wait Time
- Number of deadlocks/sec
- Lock Timeouts/sec
3) DMVs (Dynamic Management Views)
sys.dm_exec_requests
- blocking_session_id - The SPID of the blocking session.
- wait_type - Type of wait.
- wait_time - Length of time request has been waiting (in milliseconds).
- last_wait_type - If a wait has ended, its type is listed here.
- wait_resource - Name of resource the request is waiting for.
- transaction_isolation_level - Isolation level for the transaction.
- lock_timeout - Length of time a lock can exist before timing out
sys.dm_tran_locks
The request_session_id column contains the Process ID for the process. To view locking in the particular database, execute the following query that joins sys.dm_tran_locks with sys.partitions:
sys.dm_os_waiting_tasks
Execute the following to view wait stats for all block processes on SQL Server:
This detail is good for a big picture, or to get a quick idea of the types of waits occurring, but most of the real diagnostics and tuning will occur at a statement level.
4) SQL Server Profiler
- Deadlock_Graph_Event_Class — Creates an XML description of deadlocks.
- Lock:Acquired — Use in conjunction with Lock:Released to determine the types of locks being requested and the length of time they are retained.
- Lock:Cancel — Use to determine which locks are cancelled.
- Lock:Deadlock Chain — Use to determine the objects involved in a deadlock.
- Lock:Deadlock — Use to determine the objects and applications involved in a deadlock.
- Lock:Escalation — Reports information about locks that have been escalated to cover a larger resource. For example, when a row lock becomes a table lock.
- Lock:Released — Use in conjunction with Lock:Acquired.
- Lock:Timeout(timeout>0) — Provides information about locks that have timed out due to blocking issues.
- Lock:Timeout — Provides the same information as Lock:Timeout (timeout>0), but includes timeouts where the duration was 0.
5) sp_who/sp_who2
6) Use KILL statement to terminate blocked process
You must pass either a spid or, if the process belongs to a Distributed Transaction Coordination (DTC) transaction, you must provide a Unit of Work (UOW). You must be a member of sysadmin or processadmin to kill a process. You can obtain the spid for the current session by running @@spid. You can obtain the spid for the sessions associated with a login by running sp_who2. If you don’t specify a login, sp_who2 returns information for all current connections. If you can’t kill a blocking process, you might have to restart the SQL Server service. Doing so will cause all current connections to close, so you should avoid restarting the service if possible.
When to use each tool?
SQL server: Blocking issue
When I was working with couple of frequent blocking issue in our live server, I have noticed different types of wait resources which are not meaningful unless they mapped to a table or an index. In this post I will explain how to map the wait resources to table/index.
Key Wait Resource
Below is a sample of blocked process report with Key as wait resource .

The first part of the key wait resource is the database id and second part is called as Hobt_Id. Hobt is an acronym for Heap Or B Tree. The hobt_id can be mapped to sys.indexes and sys.objects through sys.partitions. Below script will map the key wait resource to corresponding index and table.

The first part of the key wait resource is the database id and second part is called as Hobt_Id. Hobt is an acronym for Heap Or B Tree. The hobt_id can be mapped to sys.indexes and sys.objects through sys.partitions. Below script will map the key wait resource to corresponding index and table.
SELECT o.name AS TableName, i.name AS IndexName,SCHEMA_NAME(o.schema_id) AS SchemaNameFROM sys.partitions p JOIN sys.objects o ON p.OBJECT_ID = o.OBJECT_ID JOIN sys.indexes i ON p.OBJECT_ID = i.OBJECT_ID AND p.index_id = i.index_id WHERE p.hobt_id = 72057594040811520
Page Wait Resource
Below is a sample of blocked process report with Page as wait resource .As everyone knows, the first part of the wait resource is the database id (68) , second part is file id (1) and third part is the page number(492478). To find out the object id associated with this page follow the below steps.
SELECT DB_NAME(68)
Select the database based on the output above statement. Then execute the below statement
DBCC traceon (3604)
GODBCC page (68, 1, 492478) --Database_id,file_id,page_id
This will give a result as given below.

Object Wait Resource
Below is a sample of blocked process report with Object as wait resource .
Here also the first part of the wait resource is the database id(68) ,second part is the object id and third part is known as lock partition id. The object id part can be mapped to an object using the object_name() system function . The lock partition id is not very useful in troubleshooting the blocking issue.This will have positive value only when the server has more than 16 CPU. I will explain more about the lock partition in my future post.