Search This Blog

Showing posts with label SQL Transaction log. Show all posts

Monitoring SQL Server database transaction log usage

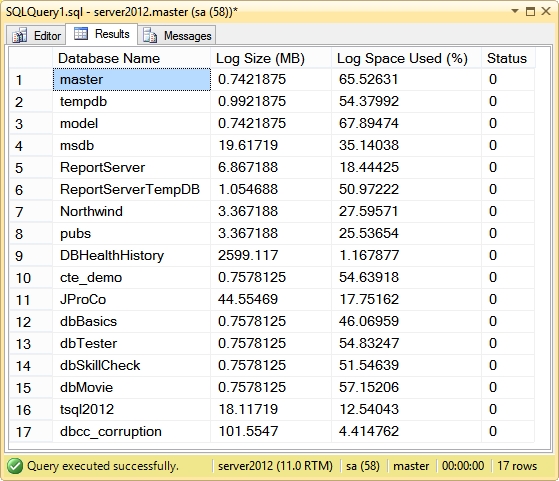
In this post I will provide a method for monitoring your database transaction logs using DBCC SQLPERF(logspace), which can be used to return transaction log space usage statistics for your databases.  We know there are many different causes for the transaction logs to expand.  It could be a very large or long-running transaction like index maintenance, or even a data archival routine (with lots of deletes).  You may also be using a FULL Recovery Model, but you aren't performing transaction log backups... or you're not performing them as frequently as you should.  

There are many causes for log growth, and you should be aware of that expansion so that you can act before a problem occurs.  This tip is a good way to keep an eye on that transaction log growth and utilization.  

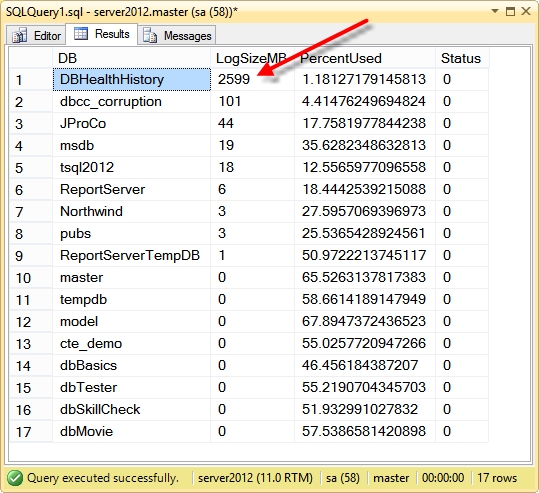
First we need a table to store the output of DBCC SQLPERF(logspace).  We will use this table to store log use statistics over time.  This will enable you to analyze historically, which will be helpful for trending and diagnosing database and log growth.   

     -- create table to store output of DBCC SQLPERF(logspace)
     CREATE TABLE dbo.MonitorLogs (
        LogID INT PRIMARY KEY IDENTITY(1,1),
        LogDate DATETIME NOT NULL DEFAULT(GETDATE()),
        DBName VARCHAR(100) NOT NULL,
        LogSizeMB DECIMAL(18, 4) NOT NULL,
        LogSpaceUsed DECIMAL(18, 4) NOT NULL,
        LogStatus INT NOT NULL
      )

Now this is how we will execute the DBCC statement, directing the output to our new table:

      INSERT dbo.MonitorLogs (DBName,LogSizeMB,LogSpaceUsed,LogStatus)
      EXEC ('DBCC SQLPERF(logspace)')

Now we need to 'create' another day of data so that we can test the process completely.  To do this, I am just going to copy the data just inserted to MonitorLogs, using DATEADD to modify the LogDate to yesterday:

     INSERT dbo.MonitorLogs (LogDate,DBName,LogSizeMB,LogSpaceUsed,LogStatus)
     SELECT DATEADD(d,-1,LogDate),DBName,LogSizeMB,LogSpaceUsed,LogStatus
     FROM dbo.MonitorLogs

Check the data, you will now see statistics from yesterday as well.  You will use this last statement to compare yesterday's data with today's.  The principal is just the monitoring of your transaction log space over time.

     DECLARE @Yesterday DATE = CONVERT(DATEGETDATE()-1);
     DECLARE @Today DATE = CONVERT(DATEGETDATE());

     SELECT 
     COALESCE(b.DBName,a.DBName) [Database],
     a.LogSizeMB [TodayLogSizeMB],
     b.LogSizeMB [YestLogSizeMB],
     a.LogSizeMB - b.LogSizeMB [SizeMBDiff],
     a.LogSpaceUsed [TodayLSpaceUsed],
     b.LogSpaceUsed [YestLSpaceUsed],
     a.LogSpaceUsed - b.LogSpaceUsed [UsedDiff]
    FROM
     dbo.MonitorLogs a FULL OUTER JOIN dbo.MonitorLogs b 
        ON a.DBName = b.DBName
    WHERE 
    CONVERT(DATE, a.LogDate) = @Yesterday 
    AND CONVERT(DATEb.LogDate) = @Today
    ORDER BY 
    TodayLogSizeMB DESC


That's pretty much it.  Your result set will look like this:

This is just one way to get the job done.  In the newer releases you should take a look at both of these DMVs:    

sys.dm_tran_database_transactions   http://msdn.microsoft.com/en-us/library/ms186957.aspx
sys.dm_tran_active_transactions        http://msdn.microsoft.com/en-us/library/ms174302.aspx

When was the last transaction log backup?

I was performing a health check on a customer's inventory recently, and I produced a list of databases where the transaction log was larger than the data file.  Of course you know, this can happen if the transaction log dumps aren't occurring, or aren't occurring often enough.  The Customer was fairly adamant that the logs were being backed up, though, so I needed a quick way to confirm the last backup time, per database.

Run this.  It will give you the RECOVERY MODEL and last transaction log dump time for all of your databases.
   SELECT
       d.name [Database],
       d.recovery_model_desc [RecoveryModel],
       MAX(b.backup_finish_date) [LastTranLogBkup]
   FROM
  master.sys.databases d LEFT OUTER JOIN msdb..backupset b
         ON b.database_name = d.name
         AND b.type = 'L'
   GROUP BY 
       d.name, 
       d.recovery_model_desc
   ORDER BY 
       LastTranLogBkup DESC


Read the SQL Server Database Transaction Log

Who deleted that data?! Or worse -- who dropped that table?!  It really frustrates me when something like this occurs on the servers that I am responsible for... yet I am unaware.  Here is a quick piece to show you that yes, we can read the database transaction log, and we can figure out who made that unauthorized change.
 
First we need to create a test table.

 
  -- create test table
   CREATE TABLE [Personnel] (
      [UserID] INT IDENTITY(1,1),
      [UserName] VARCHAR(55),
      [Dept] CHAR (25)
    );
 
--Ok. Now let us look in the log file to see that new table.
 
   -- look in log for that table creation
   SELECT 
      [Current LSN],
      [Operation],
      [Transaction Name],
      [SPID],
      [Begin Time]
    FROM   
      fn_dblog(NULL,NULL)
   WHERE  
     [Transaction Name] = 'CREATE TABLE'


--Current LSN Operation Transaction Name SPID BeginTime
--00000020:00000f70:002c LOP_BEGIN_XACT CREATE TABLE 64 2014/02/05 12:10:41:093

--Sweet!  Now let us write something into the table.

   -- write into test table
   INSERT dbo.Personnel (UserName,Dept)
    SELECT 'John Doe','Accounting'
   UNION
   SELECT 'Jane Doe','Mangement'
 
 --Look at our data:
 
   SELECT * FROM dbo.Personnel
 
--Ok. Now we are going to do that unauthorized DELETE. 

   /* delete something */
   DELETE dbo.Personnel
    WHERE UserName = 'Jane Doe'
 
--Check the log... it is there.
 
   -- read the log
   SELECT 
       [Transaction ID],
       [Operation],
       [Context],
       [AllocUnitName]
    FROM   
       fn_dblog(NULL,NULL)
   WHERE   
      Operation = 'LOP_DELETE_ROWS'
       AND AllocUnitName = 'dbo.Personnel'
 
Transaction IDOperationContextAllocUnitName
0000:00000557LOP_DELETE_ROWSLCX_HEAPdbo.Personnel

Now, we need to use that Transaction ID returned above to get the Transaction SID. 
This will help us find the actual user who performed this action.

   -- get the transaction sid
   SELECT 
       [Transaction ID],
       [Transaction SID],   
      [Operation],
       [AllocUnitName]
    FROM   
       fn_dblog(NULL,NULL)
   WHERE    
      [Transaction ID] = '0000:00000550'
 
 
Transaction IDTransaction SID  OperationAllocUnitName
0000:00000557 0x010500000000000515000000EFEE1C9FBC493493D723D1D8E8030000 LOP_DELETE_ROWS  dbo.Personnel

Ok. This is the gold! Now we use the Transaction SID to figure out who actually performed the delete!

   -- find the offending user

   USE master;
    SELECT SUSER_SNAME(0x010500000000000515000000EFEE1C9FBC493493D723D1D8E8030000) [Login]
 
Login
MyMachine\MyName

Alright. One better. Let us drop that Personnel table.
 
   -- drop table
   DROP TABLE dbo.Personnel
 
Just like before, let us get our Transaction ID, and then our Transaction SID.
 
   -- get transaction id
   SELECT
       [Transaction ID],
       [Transaction SID],
       [Transaction Name]
      [Operation],
       [Description]
    FROM  
       fn_dblog(NULL,NULL)
   WHERE
      [Transaction Name] = 'DROPOBJ'
 
And now... we find the guy who dropped the table.
 

   -- pass transaction sid to get user name

   USE master;
    SELECT SUSER_SNAME(0x010500000000000515000000EFEE1C9FBC493493D723D1D8E8030000) [Login]
 

It is undocumented, so you need to be cautious.  But, it is very easy method for reading into your transaction log files.


SQL SERVER MONITORING: SQL Transaction log Size


Monitoring the size of Transaction Log files is one of those important tasks for a SQL Server Database Administrator. I monitor regularly in order to ensure that my database log files do not grow tremendously in size and potentially run out of space. The script in this article will give the list of Databases and their Transaction Log files size in MB in the descending order.
SELECT INSTANCE_NAME AS [DATABASE],(CNTR_VALUE/1000) AS Size_In_MB

FROM MASTER.dbo.SYSPERFINFO

WHERE COUNTER_NAME LIKE ‘%Log File(s) Size (KB) %’

AND INSTANCE_NAME NOT IN (‘_Total’,'mssqlsystemresource’)

ORDER BY Size_In_MB DESC


DBCC SqlPerf(logspace) ;


DBCC_SqlPerf3


declare @LogSpace table
(
 DB varchar(255),
 LogSizeMB int,
 PercentUsed float,
 Status int
);
insert into @LogSpace
execute('DBCC SqlPerf(logspace)');
SELECT *
 FROM @LogSpace
 ORDER By LogSizeMB desc;

DBCC_SqlPerf4

SQL Server 2005 Error Log Management

SQL Server Error Log
To limit the size of the SQL Server error log, the sp_cycle_errorlog system stored procedure can be issued to start a new error log.  Depending on the growth rate of the SQL Server error log dictates when sp_cycle_errorlog should be issued.  Reference the code below as an example.
EXEC master.sys.sp_cycle_errorlog;-- Expected successful output
-- DBCC execution completed. If DBCC printed error messages, contact your system administrator.
Next, the easiest means to address this need would be to schedule a SQL Server Job to support the need.  Reference the SQLServer2005_CycletheErrorLog_Job.txt as a point of reference.

SQLServer2005_CycletheErrorLog_Job.txt

USE [msdb]
GO
/****** Object:  Job [Sample - sp_cycle_errorlog]   ******/
BEGIN TRANSACTION
DECLARE @ReturnCode INT
SELECT @ReturnCode = 0
/****** Object:  JobCategory [[Uncategorized (Local)]]]    ******/
IF NOT EXISTS (SELECT name FROM msdb.dbo.syscategories WHERE name=N'[Uncategorized (Local)]' AND category_class=1)
BEGIN
EXEC @ReturnCode = msdb.dbo.sp_add_category @class=N'JOB', @type=N'LOCAL', @name=N'[Uncategorized (Local)]'
IF (@@ERROR <> 0 OR @ReturnCode <> 0) GOTO QuitWithRollback

END

DECLARE @jobId BINARY(16)
EXEC @ReturnCode =  msdb.dbo.sp_add_job @job_name=N'Sample - sp_cycle_errorlog', 
  @enabled=0, 
  @notify_level_eventlog=0, 
  @notify_level_email=0, 
  @notify_level_netsend=0, 
  @notify_level_page=0, 
  @delete_level=0, 
  @description=N'Sample job to recycle the SQL Server Error Log                                    *** NOTE *** - This job must be enabled and a schedule must be setup in order to execute this Job', 
  @category_name=N'[Uncategorized (Local)]', 
  @owner_login_name=N'sa', @job_id = @jobId OUTPUT
IF (@@ERROR <> 0 OR @ReturnCode <> 0) GOTO QuitWithRollback
/****** Object:  Step [Recycle the SQL Server Error Log]    ******/
EXEC @ReturnCode = msdb.dbo.sp_add_jobstep @job_id=@jobId, @step_name=N'Recycle the SQL Server Error Log', 
  @step_id=1, 
  @cmdexec_success_code=0, 
  @on_success_action=1, 
  @on_success_step_id=0, 
  @on_fail_action=2, 
  @on_fail_step_id=0, 
  @retry_attempts=0, 
  @retry_interval=0, 
  @os_run_priority=0, @subsystem=N'TSQL', 
  @command=N'EXEC master.sys.sp_cycle_errorlog;', 
  @database_name=N'master', 
  @flags=0
IF (@@ERROR <> 0 OR @ReturnCode <> 0) GOTO QuitWithRollback
EXEC @ReturnCode = msdb.dbo.sp_update_job @job_id = @jobId, @start_step_id = 1
IF (@@ERROR <> 0 OR @ReturnCode <> 0) GOTO QuitWithRollback
EXEC @ReturnCode = msdb.dbo.sp_add_jobserver @job_id = @jobId, @server_name = N'(local)'
IF (@@ERROR <> 0 OR @ReturnCode <> 0) GOTO QuitWithRollback
COMMIT TRANSACTION
GOTO EndSave
QuitWithRollback:
 IF (@@TRANCOUNT > 0) ROLLBACK TRANSACTION
EndSave:


Finally, to address not loosing the historical SQL Server error log, the number of logs should be expanded beyond the default of 7.  The maximum number of logs is 99 for the SQL Server error log.  When it comes to expanding the number of SQL Server error logs, follow these steps:
  • Open Management Studio
  • Navigate to root | Management folder | SQL Server Logs folder
  • Right click on the SQL Server Logs folder and select the 'Configure' option
  • Select the 'Limit the number of error log files before they are recycled' check box
    • Reference the screen shot below as a point of reference
  • Enter the desired number of error logs in the 'Maximum number of error log files'
    • Reference the screen shot below as a point of reference   
  • Press the 'OK' button to save the configuration
Alternatively, the following code can be used to automate the process across multiple SQL Servers:
USE [master]
GO
EXEC xp_instance_regwrite N'HKEY_LOCAL_MACHINE', N'Software\Microsoft\MSSQLServer\MSSQLServer', N'NumErrorLogs', REG_DWORD, 50
GO
SQL Server Agent Error Log
The SQL Server Agent error log follows much of the same paradigm as the SQL Server error log.  The recycling process is completed by the sp_cycle_agent_errorlog in the MSDB database.
EXEC msdb.dbo.sp_cycle_agent_errorlog;
-- Expected successful output
-- Command(s) completed successfully.
In terms of configuring a specified number of SQL Server Agent error logs, this is not possible.  Only the current and 9 additional (a total of 10) SQL Server Agent error logs will be retained.  What can be configured are the type of messages (Errors, Warnings, Informational ) that are written to the SQL Server Agent error logs.  To access this interface, follow these steps:
  • Open Management Studio
  • Navigate to root | SQL Server Agent | Error Logs folder
  • Right click on the Error Logs folder and select the 'Configure' option, reference the screen shot below

To automate this process across servers, reference the sp_set_sqlagent_properties system stored procedure.  Below outlines a sample execution.
USE [msdb]
GO
EXEC msdb.dbo.sp_set_sqlagent_properties @errorlogging_level=7
GO
Alternative Error Log Access
The primary interface to access the SQL Server Error Logs is via the Log File Viewer.  This application provides insight into the SQL Server and Windows logs.  This application provides a means to review multiple logs as well as search and filter the logs.  If you do have a large error log that causes issues for this application, this should be copied and pasted and then the copied log can be reviewed via DOS's type command.  Although this is a less than ideal interface, it appears to provide immediate access and will not affect SQL Server writing new records to the original log.  Below is an example of reading a SQL Server Error log via DOS's type command.

Reading the SQL Server log files using TSQL

One of the issues I have is that the SQL Server Error Log is quite large and it is not always easy to view the contents with the Log File Viewer.  In a previous tip "Simple way to find errors in SQL Server error log" you discussed a method of searching the error log using VBScript.  Are there any other easy ways to search and find errors in the error log files?
SolutionSQL Server 2005 offers an undocumented system stored procedure sp_readerrorlog.  This SP allows you to read the contents of the SQL Server error log files directly from a query window and also allows you to search for certain keywords when reading the error file.  This is not new to SQL Server 2005, but this tip discusses how this works for SQL Server 2005.
This is a sample of the stored procedure for SQL Server 2005.  You will see that when this gets called it calls an extended stored procedure xp_readerrorlog.
CREATE PROC [sys].[sp_readerrorlog](
   
@p1     INT = 0,
   
@p2     INT = NULL,
   
@p3     VARCHAR(255NULL,
   
@p4     VARCHAR(255NULL) AS
BEGIN

   IF 
(NOT IS_SRVROLEMEMBER(N'securityadmin'1)
   
BEGIN
      RAISERROR
(15003,-1,-1N'securityadmin')
      
RETURN (1)
   
END
  
   IF 
(@p2 IS NULL)
       
EXEC sys.xp_readerrorlog @p1
   
ELSE
       EXEC 
sys.xp_readerrorlog @p1,@p2,@p3,@p4 END
This procedure takes four parameters:
  1. Value of error log file you want to read: 0 = current, 1 = Archive #1, 2 = Archive #2, etc...
  2. Log file type: 1 or NULL = error log, 2 = SQL Agent log
  3. Search string 1: String one you want to search for
  4. Search string 2: String two you want to search for to further refine the results
If you do not pass any parameters this will return the contents of the current error log.
Here are a few examples:
Example 1
EXEC sp_readerrorlog 6
This statement returns all of the rows from the 6th archived error log.


Example 2
EXEC sp_readerrorlog 61'2005'
This returns just 8 rows wherever the value 2005 appears.

Example 3
EXEC sp_readerrorlog 61'2005', 'exec'
This returns only rows where the value '2005' and 'exec' exist.


xp_readerrrorlog
Even though sp_readerrolog accepts only 4 parameters, the extended stored procedure accepts at least 7 parameters.
If this extended stored procedure is called directly the parameters are as follows:
  1. Value of error log file you want to read: 0 = current, 1 = Archive #1, 2 = Archive #2, etc...
  2. Log file type: 1 or NULL = error log, 2 = SQL Agent log
  3. Search string 1: String one you want to search for
  4. Search string 2: String two you want to search for to further refine the results
  5. Search from start time  
  6. Search to end time
  7. Sort order for results: N'asc' = ascending, N'desc' = descending
EXEC master.dbo.xp_readerrorlog 61'2005''exec', NULL, NULL, N'desc' EXEC master.dbo.xp_readerrorlog 61'2005''exec', NULL, NULL, N'asc'


Examples:
Exec sp_readerrorlog
The above command all the contents from current SQL Server errorlog.
errorlog1
Exec sp_readerrorlog 1,1,‘memory’
The above command reads the first SQL Server Archived Error log and searches for returns the result wherever “memory” appears
errorlog2


Reading the SQL Server log files - Part2
How to read the SQL Server Database Transaction Log

I will explain how to read your database transaction log file and how transactions are written for your database if you perform any database activity. This tip is helpful if you want to know what the transaction log file captures. There is an undocumented function called "fn_dblog" which enables you to read data from your transaction log which contains very informative data about things that are happening in your database. I strongly suggest testing any undocumented features in a lab environment first.
The function (fn_dblog) requires a beginning LSN and ending LSN for a transaction.  NULL is the default for this function and this will return all log records from the transaction log file.

Create a Test Database

To show how this works, we will create a database and a table to play with this function. Run the below SQL code to create a database and table.
--Create DB.
USE [master];
GO
CREATE DATABASE ReadingDBLog;
GO
-- Create tables.
USE ReadingDBLog;
GO
CREATE TABLE [Location] (
    [Sr.No] INT IDENTITY,
    [Date] DATETIME DEFAULT GETDATE (),
    [City] CHAR (25) DEFAULT 'Bangalore');
We have created a database named "ReadingDBLog" and a table 'Location' with three columns. Now you can check all information and processes which have been used by SQL Server to create the database and table. We will run the below code to check the log file for this newly created database to check what processes and steps SQL Server took to create the database and table.
USE ReadingDBLog;
GO
select COUNT(*) from fn_dblog(null,null)


No of rows generated during creating a db and table
We can see there are 339 rows that have been generated for just creating a dummy database and a blank table. You can go and check the logs by using this function to get details for all processes used to create the database and table. Look at the below code to see the data in the transaction log file.
USE ReadingDBLog;
GO
select [Current LSN],
       [Operation],
       [Transaction Name],
       [Transaction ID],
       [Transaction SID],
       [SPID],
       [Begin Time]
FROM   fn_dblog(null,null)


Capture data from log file of newly created database
As the total number of rows and columns are large, I gave a snapshot of some of the columns and rows but I have tried to capture a few informative columns here. You can see in the above screenshot that the transaction name column shows the database name, similarly it will show the create table for the table creation code. Transaction ID is the same for all parts of a transaction. The value for transaction name will be filled only when the particular transaction starts with "LOP_BEGIN_XACT" in the Operation column. "LOP_BEGIN_XACT" means begin transaction. The operation column will let us know which operation is performing like an insert, update, delete, shrink, lock, page allocation etc...  It is pretty easy to understand the operation based on these key words to see what operation is being performed by SQL Server.

Run some DML commands to see what is captured

Now we will run a few DML scripts to check how data insertion, updating or deletion is logged in the database log file. During this operation you can also track how a page is allocated or de-allocated.
USE ReadingDBLog
go
INSERT INTO Location DEFAULT VALUES ;
GO 100
GO
UPDATE Location
SET City='New Delhi'
WHERE [Sr.No]<5
GO
DELETE Location 
WHERE [Sr.No]>90
Go
Let's check our database log file again. As we saw from above, there is a lot of info logged in the transaction log file, so I will filter the data.
USE ReadingDBLog
go
SELECT
 [Current LSN],
 [Transaction ID],
 [Operation],
  [Transaction Name],
 [CONTEXT],
 [AllocUnitName],
 [Page ID],
 [Slot ID],
 [Begin Time],
 [End Time],
 [Number of Locks],
 [Lock Information]
FROM sys.fn_dblog(NULL,NULL)
WHERE Operation IN 
   ('LOP_INSERT_ROWS','LOP_MODIFY_ROW',
    'LOP_DELETE_ROWS','LOP_BEGIN_XACT','LOP_COMMIT_XACT')  


Output of DML cmd in t-log file
Your output will look something like the above screenshot after running the above script.
Let's see how we can read the output. You can see the highlighted area which we will read as:
  • INSERT statement with transaction ID 0000:00000448
  • started at 2013/09/27 16:50:44:530
  • INSERTed a row in a HEAP table 'dbo.Location' in pageID 0001:00000099
  • finished at 2013/09/27 16:50:44:530
 Similarly, it will show you this same kind of information for UPDATE and DELETE statements.

Finding internal SQL Server operations in transaction log

We can also check internal functions of SQL Server through this function. Let's take for example page splitting. We can track all info about page splits like how many times page splits occur, on which page and during which operation. Let's take a look at this below to see page splits for the above INSERT operation. Run the below SQL code to get all operations related to page splits.
USE ReadingDBLog
go
--Get how many times page split occurs.
SELECT 
 [Current LSN],
 [Transaction ID],
 [Operation],
  [Transaction Name],
 [CONTEXT],
 [AllocUnitName],
 [Page ID],
 [Slot ID],
 [Begin Time],
 [End Time],
 [Number of Locks],
 [Lock Information]
FROM sys.fn_dblog(NULL,NULL)
WHERE [Transaction Name]='SplitPage' 
GO

--Get what all steps SQL Server performs during a single Page Split occurrence.
SELECT 
 [Current LSN],
 [Transaction ID],
 [Operation],
  [Transaction Name],
 [CONTEXT],
 [AllocUnitName],
 [Page ID],
 [Slot ID],
 [Begin Time],
 [End Time],
 [Number of Locks],
 [Lock Information]
FROM sys.fn_dblog(NULL,NULL)
WHERE [Transaction ID]='0000:00000451'  


Capture Page Split in t-log
As you can see above Page Split occur three times for the above DML activity. The first script will let us know how many times page splits occurred and the second script elaborates on the internal processes SQL Server ran during a single Page Split operation. The above image takes the first page split, transaction ID '0000:00000451', and shows all internal processes in the second result set.
Similarly if you drop any object or you perform other database operations they will get logged in the transaction log file which will then be visible using this function.

How a backup interacts with the transaction log

Now I will run a backup and see the transaction log file again. Run a backup on this database and then again check the transaction log file.
SELECT COUNT(*)
FROM fn_dblog(null,null)
GO

BACKUP DATABASE ReadingDBLog TO DISK = 'c:\ReadingDBLog_Full.bak'
GO

SELECT COUNT(*)
FROM fn_dblog(null,null)
GO


Run backup to see the changes in t-log
As we can see, the number of rows has been drastically reduced after doing a backup and it has been reduced to 9 rows from 528. This means the inactive part of the log which tracked the transactions has been dumped to a backup file and the original entries from the log file have been flushed. Now you can shrink the log file if necessary.

Other things you can do

You can also use the DBCC Log() command to see log information, but this command will not give you detail information. You can also use trace flag 2537 to look at all logs and not just the active log.