Search This Blog

SQL Server:User Permissions


Grant permissions to users to create jobs in Sql Server

There are roles in msdb database that help database administrators to have better granular control over job creation, execution, and browsing:
SQLAgentUserRole, SQLAgentReaderRole, and SQLAgentOperatorRole.
To grant users permission to create and schedule their own jobs, use this script:
USE [msdb]
GO
CREATE USER [UserName] FOR LOGIN [LoginName]
GO
USE [msdb]
GO
EXEC sp_addrolemember 'SQLAgentUserRole', 'UserName'
GO
To grant a domain group permission to create and schedule their own jobs, use this script:
USE [msdb]
exec sp_addrolemember 'SQLAgentUserRole', 'DomainName\GroupName'
Members of SQLAgentUserRole have permissions on only local jobs and job schedules that they own.
You can add user to the SQLAgentUserRole in Management Studio (Right-click the login you wish to add to a SQL Server Agent fixed database role, and select Properties):
-----------------------------

Configuring user permissions for Microsoft SQL Agent

Microsoft SQL Server defines SQL Server Agent roles that govern accessibility of the job framework. The SQL Server Agent jobs are stored in the SQL Server msdb database.
To install Websense Log Server successfully, the user account that owns the Websense database must have membership in one of the following roles in the msdb database:
*SQLAgentUserRole
*SQLAgentReader Role
*SQLAgentOperator Role
The SQL user account must also be a member of the dbcreator fixed server role.
Use Microsoft SQL Server Management Studio to grant the database user account the necessary permissions to successfully install Log Server.

1.On the SQL Server machine, go to Start > Programs > Microsoft SQL Server 2005 or 2008 > Microsoft SQL Server Management Studio.
2.Select the Object Explorer tree, and then go to select Security > Logins.
3.Select the login account to be used during the installation.
4.Right-click the login account and select Properties for this user.
5.Select User Mapping and do the following:
a.Select msdb in database mapping.
b.Grant membership to one of these roles:
*SQLAgentUserRole
*SQLAgentReader Role
*SQLAgentOperator Role
c.Click OK to save your changes.
6.Select Server Roles, and then select dbcreator. The dbcreator role is created.
7.Click OK to save your changes.

SQL SERVER – Query Optimization – Remove Bookmark Lookup – Remove RID Lookup – Remove Key Lookup

Today, I would like to share one very quick tip about how to remove bookmark lookup or RID lookup. Let us first understand Bookmark lookup or RID lookup. Please note that from SQL Server 2005 SP1 onwards, Bookmark look up is known as Key look up.
When a small number of rows are requested by a query, the SQL Server optimizer will try to use a non-clustered index on the column or columns contained in the WHERE clause to retrieve the data requested by the query. If the query requests data from columns not present in the non-clustered index, SQL Server must go back to the data pages to get the data in those columns. Even if the table has a clustered index or not, the query will still have to return to the table or clustered index to retrieve the data.
In the above scenario, if table has clustered index, it is called bookmark lookup (or key lookup); if the table does not have clustered index, but a non-clustered index, it is called RID lookup. This operation is very expensive. To optimize any query containing bookmark lookup or RID lookup, it should be removed from the execution plan to improve performance. There are two different ways to remove bookmark/RID lookup.
Before we understand these two methods, we will create sample table without clustered index and simulate RID lookup. RID Lookup is a bookmark lookup on a heap that uses a supplied row identifier (RID).
USE tempdb
GO
-- Create Table OneIndex with few columnsCREATE TABLE OneIndex (ID INT,FirstName VARCHAR(100),LastName VARCHAR(100),City VARCHAR(100))GO-- Insert One Hundred Thousand RecordsINSERT INTO OneIndex (ID,FirstName,LastName,City)SELECT TOP 100000 ROW_NUMBER() OVER (ORDER BY a.nameRowID,'Bob',CASE WHEN ROW_NUMBER() OVER (ORDER BY a.name)%THEN 'Smith'ELSE 'Brown' END,CASEWHEN ROW_NUMBER() OVER (ORDER BY a.name)%1000 THEN 'Las Vegas'WHEN ROW_NUMBER() OVER (ORDER BY a.name)%10 THEN 'New York'WHEN ROW_NUMBER() OVER (ORDER BY a.name)%10 THEN 'San Marino'WHEN ROW_NUMBER() OVER (ORDER BY a.name)%10 THEN 'Los Angeles'ELSE 'Houston' END
FROM 
sys.all_objects aCROSS JOIN sys.all_objects b
GO
Now let us run following select statement and check the execution plan.
SELECT IDFirstNameFROM OneIndexWHERE City 'Las Vegas'GO
As there is no index on table, scan is performed over the table. We will create a clustered index on the table and check the execution plan once again.
-- Create Clustered IndexCREATE CLUSTERED INDEX [IX_OneIndex_ID] ON [dbo].[OneIndex]([ID] ASCON [PRIMARY]
GO
Now, run following select on the table once again.
SELECT IDFirstNameFROM OneIndexWHERE City 'Las Vegas'GO
It is clear from execution plan that as a clustered index is created on the table, table scan is now converted to clustered index scan. In either case, base table is completely scanned and there is no seek on the table.
Now, let us see the WHERE clause of our table. From our basic observation, if we create an index on the column that contains the clause, a performance improvement may be obtained. Let us create non-clustered index on the table and then check the execution plan.
-- Create Index on Column City As that is used in where conditionCREATE NONCLUSTERED INDEX [IX_OneIndex_City] ON [dbo].[OneIndex]([City] ASCON [PRIMARY]
GO
After creating the non-clustered index, let us run our select statement again and check the execution plan.
SELECT IDFirstNameFROM OneIndexWHERE City 'Las Vegas'GO
As we have an index on the WHERE clause, the SQL Server query execution engine uses the non-clustered index to retrieve data from the table. However, the columns used in the SELECT clause are still not part of the index, and to display those columns, the engine will have to go to the base table again and retrieve those columns. This particular behavior is known as bookmark lookup or key lookup.
There are two different methods to resolve this issue. I have demonstrated both the methods together; however, it is recommended that you use any one of these methods for removing key lookup. I prefer Method 2.
Method 1: Creating non-clustered cover index.
In this method, we will create non-clustered index containing the columns, which are used in the SELECT statement, along with the column which is used in the WHERE clause.
CREATE NONCLUSTERED INDEX [IX_OneIndex_Cover] ON [dbo].[OneIndex](CityFirstNameIDON [PRIMARY]
GO
Once the above non-clustered index, which covers all the columns in query, is created, let us run the following SELECT statement and check our execution plan.
SELECT IDFirstNameFROM OneIndexWHERE City 'Las Vegas'GO
From the execution plan, we can confirm that key lookup is removed the only index seek is happening. As there is no key lookup, the SQL Server query engine does not have to go to retrieve the data from data pages and it obtains all the necessary data from index itself.
Method 2: Creating an included column non-clustered index.
Here, we will create non-clustered index that also includes the columns, which are used in the SELECT statement, along with the column used in the WHERE clause. In this method, we will use new syntax introduced in SQL Server 2005. An index with included nonkey columns can significantly improve query performance when all columns in the query are included in the index.
CREATE NONCLUSTERED INDEX [IX_OneIndex_Include] ON [dbo].[OneIndex](CityINCLUDE (FirstName,IDON [PRIMARY]
GO
From the execution plan, it is very clear that this method  also removes the key lookup as well.
In summary, Key lookup, Bookmark lookup or RID lookup reduces the performance of query, and we can improve the performance of query by using included column index or cover index.
I will cover few additional concepts related to the optimal method in another article.

SQL Server Simple and Forced Parameterization

Problem
I have heard about parameterization for SQL Server queries, but what is Forced and Simple Parameterization and which one should I use for my SQL Server database?
Solution
There are two different parameterization options that one can use in SQL Server. Simple parameterization and Forced parameterization. Let's discuss each a little more in detail.

Simple Parameterization

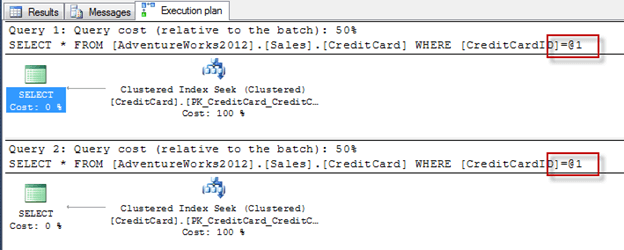
When you execute a SQL statement without parameters, SQL Server internally will add parameters where needed so that it can try to reuse a cached execution plan. For example, if you look at the execution plan of the following statement you will see that SQL Server changes the WHERE value to a parameter (@1):
SELECT * FROM AdventureWorks2012.Sales.CreditCard WHERE CreditCardID = 11

Simple Parameterization
SQL Server builds this execution plan as if a parameter was the input instead of the number 11. Because of this parameterization, the following two statements show an example of SQL Server reusing the same execution plan even though the data results are different:
SELECT * FROM AdventureWorks2012.Sales.CreditCard WHERE CreditCardID = 11
SELECT * FROM AdventureWorks2012.Sales.CreditCard WHERE CreditCardID = 207

SQL Server builds this execution plan as if a parameter was the input
This is the default behavior for Simple parameterization, however, it only applies to a small class of queries. If you want all your queries parameterized, you will need to enable the option, Forced parameterization.

Forced Parameterization

Forced parameterization is when the database engine parameterizes any literal value that appears in a SELECT, UPDATE, INSERT, or DELETE statement submitted in any form, but there are a few exceptions.  Refer to this article for a list of these exceptions.
Some applications use queries that pass in literals as opposed to stored procedures that pass in parameters. For these type of applications you may want to experiment with enabling Forced parameterization to see if it has a positive effect on the workload by reducing query compilations.
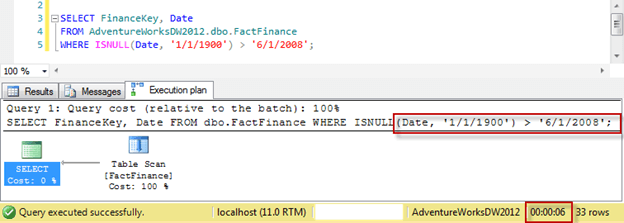
Running the following query in Simple parameterization produces the following execution plan where the WHERE clause is not parameterized:
unning the following query in Simple parameterization produces the following execution plan
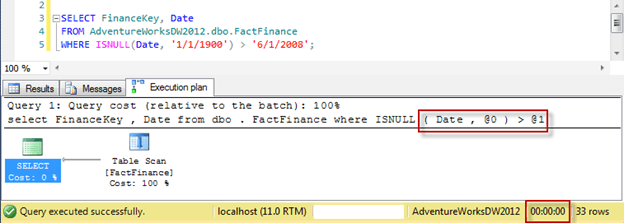
After enabling Forced parameterization and running the same query we get the following execution plan where the execution plan is parameterized:
enabling Forced parameterization
Keep in mind that in some cases when the data in a table is highly skewed, Forced parameterization may cause a suboptimal plan to be reused, thus degrading performance.

Enabling Parameterization

To determine the current setting of parameterization you can run the following query:
SELECT name, is_parameterization_forced FROM sys.databases
  • 1 indicates Forced
  • 0 indicates Simple
To enable Parameterization you can use the following ALTER DATABASE statements:
 --Forced
ALTER DATABASE AdventureWorks2012 SET PARAMETERIZATION FORCED

--Simple
ALTER DATABASE AdventureWorks2012 SET PARAMETERIZATION SIMPLE
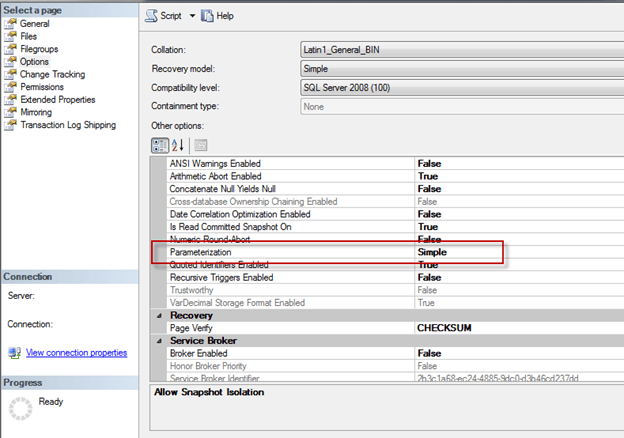
...Or you can use SSMS.  Right click on the database then go to Properties, Options, Parameterization as shown below:
you can use SSMS. Right click on the database, Properties, Options, Parameterization

Using Plan Guides

After testing your workload you may find that Forced parameterization seems to work better for your SQL Server, but you notice a few statements that aren't performing well that were optimized before you made the parameterization change. In this case, you could use a plan guide to change such statements to use Simple parameterization. The following is an example of where a query will perform better using Simple parameterization:
EXEC sp_create_plan_guide
  @name=N'PlanGuide_Demo', 
  @stmt=N'SELECT * FROM AdventureWorks2012.Sales.CreditCard WHERE CreditCardID = @CID', 
  @type = N'TEMPLATE', 
  @module_or_batch = NULL, 
  @params = N'@CID int', 
  @hints = N'OPTION(PARAMETERIZATION SIMPLE)'; 
GO

How do I know if my query is even parameterized?

The easiest way to find out if a query is parameterized is to use graphical XML plan. Just point to the operator and take a look at some of the seek predicate.
Let's use this update example:
update t1 set c1 = 12, c2 = 23 where c1 = 12
The table t1 has c1 as clustered primary key (the reason why I also update c1 is related to customer's problem which I will talk about later). So the plan has a clustered index seek predicate on c1.
If the plan is parameterized, you will see the seek predicate on c1 as "Scalar Operator (CONVERT_IMPLICIT(int,..)" or "Scalar Operator (@2)" as shown in figure 1. But if the plan is not parameterized, the hard coded value will show up in the seek predicate like "Scalar Operator (12)" as shown in figure 2 below.
Figure 1

Figure 2

SQL Performance Queries (DMV Queries)

The 1st query below tells you which stored procedures are being called the most often, which is good to know for baseline and troubleshooting purposes. Don’t be fooled into assuming that the SP that is called the most often is the most costly though. It may well be that you have other stored procedures that are not called as much, which are much more costly (in different ways) than the most frequently called SPs.
Query 2 shows the top 20 stored procedures sorted by total worker time (which equates to CPU pressure). This will tell you the most expensive stored procedures from a CPU perspective.
Query 3 shows the top 20 stored procedures sorted by total logical reads(which equates to memory pressure). This will tell you the most expensive stored procedures from a memory perspective, and indirectly from a read I/O perspective.
Query 4 shows the top 20 stored procedures sorted by total physical reads(which equates to read I/O pressure). This will tell you the most expensive stored procedures from a read I/O perspective.
Query 5 shows the top 20 stored procedures sorted by total logical writes(which equates to write I/O pressure). This will tell you the most expensive stored procedures from a write I/O perspective.
In an upcoming post, I will explain how to interpret the results of these queries, and more importantly, some steps to improve the queries that show up at the top of your lists.

Query 1
    -- Get Top 100 executed SP's ordered by execution count
    SELECT TOP 100 qt.text AS 'SP Name', qs.execution_count AS 'Execution Count',  
    qs.execution_count/DATEDIFF(Second, qs.creation_time, GetDate()) AS 'Calls/Second',
    qs.total_worker_time/qs.execution_count AS 'AvgWorkerTime',
    qs.total_worker_time AS 'TotalWorkerTime',
    qs.total_elapsed_time/qs.execution_count AS 'AvgElapsedTime',
    qs.max_logical_reads, qs.max_logical_writes, qs.total_physical_reads, 
    DATEDIFF(Minute, qs.creation_time, GetDate()) AS 'Age in Cache'
    FROM sys.dm_exec_query_stats AS qs
    CROSS APPLY sys.dm_exec_sql_text(qs.sql_handle) AS qt
    WHERE qt.dbid = db_id() -- Filter by current database
    ORDER BY qs.execution_count DESC

Query 2
    -- Get Top 20 executed SP's ordered by total worker time (CPU pressure)
    SELECT TOP 20 qt.text AS 'SP Name', qs.total_worker_time AS 'TotalWorkerTime', 
    qs.total_worker_time/qs.execution_count AS 'AvgWorkerTime',
    qs.execution_count AS 'Execution Count', 
    ISNULL(qs.execution_count/DATEDIFF(Second, qs.creation_time, GetDate()), 0) AS 'Calls/Second',
    ISNULL(qs.total_elapsed_time/qs.execution_count, 0) AS 'AvgElapsedTime', 
    qs.max_logical_reads, qs.max_logical_writes, 
    DATEDIFF(Minute, qs.creation_time, GetDate()) AS 'Age in Cache'
    FROM sys.dm_exec_query_stats AS qs
    CROSS APPLY sys.dm_exec_sql_text(qs.sql_handle) AS qt
    WHERE qt.dbid = db_id() -- Filter by current database
    ORDER BY qs.total_worker_time DESC
    
Query 3
    -- Get Top 20 executed SP's ordered by logical reads (memory pressure)
    SELECT TOP 20 qt.text AS 'SP Name', total_logical_reads, 
    qs.execution_count AS 'Execution Count', total_logical_reads/qs.execution_count AS 'AvgLogicalReads',
    qs.execution_count/DATEDIFF(Second, qs.creation_time, GetDate()) AS 'Calls/Second', 
    qs.total_worker_time/qs.execution_count AS 'AvgWorkerTime',
    qs.total_worker_time AS 'TotalWorkerTime',
    qs.total_elapsed_time/qs.execution_count AS 'AvgElapsedTime',
    qs.total_logical_writes,
    qs.max_logical_reads, qs.max_logical_writes, qs.total_physical_reads, 
    DATEDIFF(Minute, qs.creation_time, GetDate()) AS 'Age in Cache', qt.dbid 
    FROM sys.dm_exec_query_stats AS qs
    CROSS APPLY sys.dm_exec_sql_text(qs.sql_handle) AS qt
    WHERE qt.dbid = db_id() -- Filter by current database
    ORDER BY total_logical_reads DESC

Query 4

    -- Get Top 20 executed SP's ordered by physical reads (read I/O pressure)
    SELECT TOP 20 qt.text AS 'SP Name', qs.total_physical_reads, qs.total_physical_reads/qs.execution_count AS 'Avg Physical Reads',
    qs.execution_count AS 'Execution Count',
    qs.execution_count/DATEDIFF(Second, qs.creation_time, GetDate()) AS 'Calls/Second',  
    qs.total_worker_time/qs.execution_count AS 'AvgWorkerTime',
    qs.total_worker_time AS 'TotalWorkerTime',
    qs.total_elapsed_time/qs.execution_count AS 'AvgElapsedTime',
    qs.max_logical_reads, qs.max_logical_writes,  
    DATEDIFF(Minute, qs.creation_time, GetDate()) AS 'Age in Cache', qt.dbid 
    FROM sys.dm_exec_query_stats AS qs
    CROSS APPLY sys.dm_exec_sql_text(qs.sql_handle) AS qt
    WHERE qt.dbid = db_id() -- Filter by current database
    ORDER BY qs.total_physical_reads DESC

Query 5

    -- Get Top 20 executed SP's ordered by logical writes/minute
    SELECT TOP 20 qt.text AS 'SP Name', qs.total_logical_writes, qs.total_logical_writes/qs.execution_count AS 'AvgLogicalWrites',
    qs.total_logical_writes/DATEDIFF(Minute, qs.creation_time, GetDate()) AS 'Logical Writes/Min',  
    qs.execution_count AS 'Execution Count', 
    qs.execution_count/DATEDIFF(Second, qs.creation_time, GetDate()) AS 'Calls/Second', 
    qs.total_worker_time/qs.execution_count AS 'AvgWorkerTime',
    qs.total_worker_time AS 'TotalWorkerTime',
    qs.total_elapsed_time/qs.execution_count AS 'AvgElapsedTime',
    qs.max_logical_reads, qs.max_logical_writes, qs.total_physical_reads, 
    DATEDIFF(Minute, qs.creation_time, GetDate()) AS 'Age in Cache',
    qs.total_physical_reads/qs.execution_count AS 'Avg Physical Reads', qt.dbid
    FROM sys.dm_exec_query_stats AS qs
    CROSS APPLY sys.dm_exec_sql_text(qs.sql_handle) AS qt
    WHERE qt.dbid = db_id() -- Filter by current database
    ORDER BY qs.total_logical_writes DESC